Application Bandwidth Statistics
Note: To run this report fully, you need a Layer 7 license (deep packet inspection). Without this, limited information is available.
The Application bandwidth statistics report provides details of the bandwidth used by application groups, including:
- Incoming and outgoing bandwidth
- Bandwidth used by individual IP addresses
- Bandwidth used by individual applications
- Bandwidth across external interfaces, or bridges, or both
- Drill down through the report from application bandwidth into IP address bandwidth, and vice versa.
- Application classification into groups, and bandwidth measurements of these groups, see our knowledge base article, Layer 7 Application Classifications.
To run the report for a specific traffic direction and interface, click Advanced » and choose the traffic direction from the Data flow direction to highlight list, and interface from the Interface list. Enter the date range and click Run report.
Generated Report
The generated Application Bandwidth Statistics report is broken down into the following sections.
Traffic statistics
Shows the incoming and outgoing bandwidth as a graph, over the specified date range.

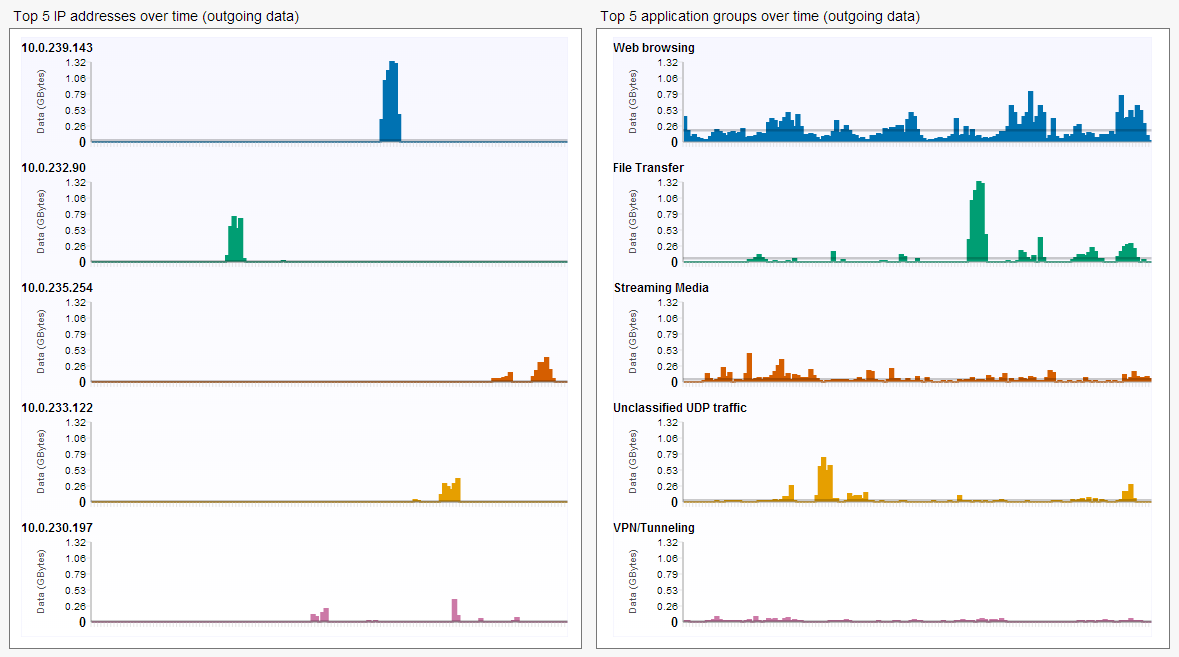
Top 5 IP addresses over time
Shows the bandwidth used, as a graph, for each of the top five IP address. Incoming or outgoing data is shown, dependent on the traffic direction chosen when running the report.
Top 5 application groups over time
Shows the bandwidth used, as a graph, for each of the top five application groups. Incoming or outgoing data is shown, dependent on the traffic direction chosen when running the report.
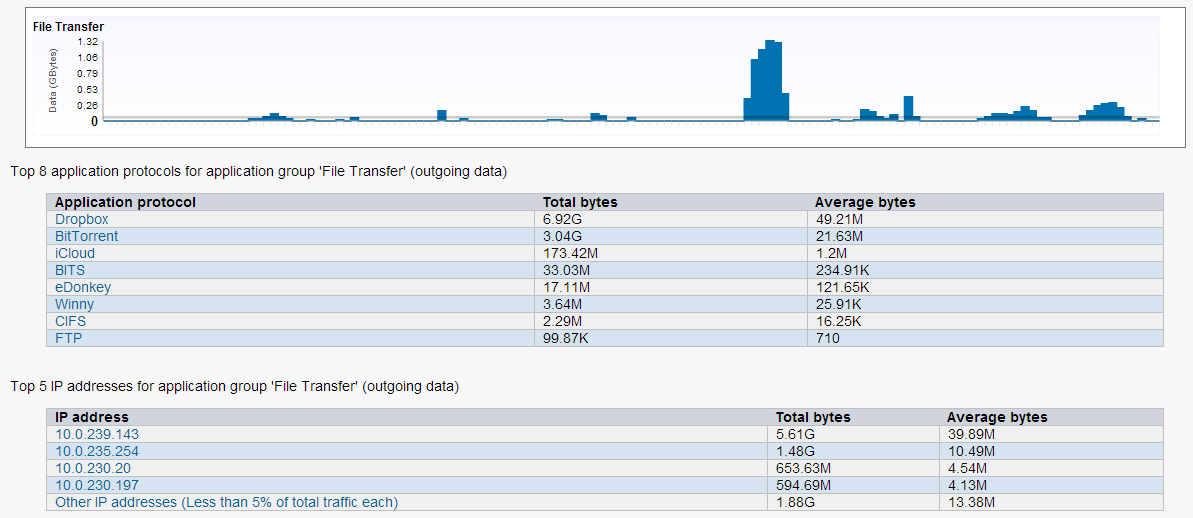
You can also drill down through the graphs to show a further breakdown of either the IP addresses that accessed the application groups, or the application groups accessed by the IP address. The following example is a breakdown of the File Transfer application group from the previous image:
Note: When you drill down through the report, the Traffic statistics graph is always displayed at the top.